
Interactive map in the portal
Integrate OpenStreetMap with ServiceNow records in the Portal

This article shows how to display records from SericeNow that are related to a location on a map in the ServiceNow portal, using OpenStreetMap (OSM).
For this purpose, we will create a portal Widget and make it interact with a list to show the records related to the choosen location.
Instead of relying on the google map services, it use instead OpenStreetMap (OSM) data 1
To achieve this, it relies on the open-source Javascript library Leafletjs to render interactive maps2.
While there are a number of other libraries to render maps, like OpenLayers3, Leaflet has the advantage of being lighweight and easier to use.
So as we don’t need to cope with more complexe stuff like geo projections and handling various geo data sources, Leaflet offer all the functionnalities we need for a simple map and is enough for our needs.
A simple use case…
The use case in scope for of this article is quite simple: we want to show the users on a map, grouped by location if there are more than one, and then filter a list of users according the location the we click on the map.
There are mainly 3 parts:
- Create a Widget to show the map
- Query the data for ServiceNow and show them on the map
- Enable interaction with the ServiceNow Portal when a location is selected on the map
We will now go through all the steps and build incrementally the map widget.
How Leaflet works
As said before, we are using the Leaflet.js API for all our mapping needs.
Before jumping in ServiceNow to build the widget, I suggest you to take a few minutes to read at least the Leaftet’s Quick Start Guide4.
The key points are mainly:
- We need the library and css in the page
- The HTML part is very simple, just a
<DIV>tag - Then in the code we need:
- to create the map with
L.mapand make the link with the<DIV>tag - Use
setViewto indicate where to center the map and the scale to use - build the tileLayer with
L.tileLayer, and that where we incidcate the OpenStreetMap tiles server - Add the features on the map with
L.marker - We need then to react on click to interract with the portal and also center the map on the clicked feature
- to create the map with
Building the map widget
To start buidling the map widget, I recommand using a custom scoped application in ServiceNow.
When your application is created, create a new Portal Widget:
- Name : Leaflet Map
- ID: leaflet_map
store the Leaflet API scripts as widget dependencies
When creating the dependencies, you can either use a link to the Leaflet script online or store a copy in the ServiceNow instance.
I recommand storing a copy, so we don’t depedant on other servers availlability for this part.
To do so, start by downloading the Libraries, either from the UNPKG repository 5 or from the Leaflet web site 6.
We need the two following files:
- leaflet.js
- leaflet.css
Then create a new Widget Dependency called “Leaflet” and add a new JS include and a new CSS include containing repectively the content of file leaflet.js and leaflet.css.
Set the HTML, CSS and client script for a first test
Set the HTML part as follow:
<div id="map"></div>
Then the CSS part:
#map {
  position: absolute;
  top: 0px;
  left: 0px;
  width: 500px;
  height: 500px;
}
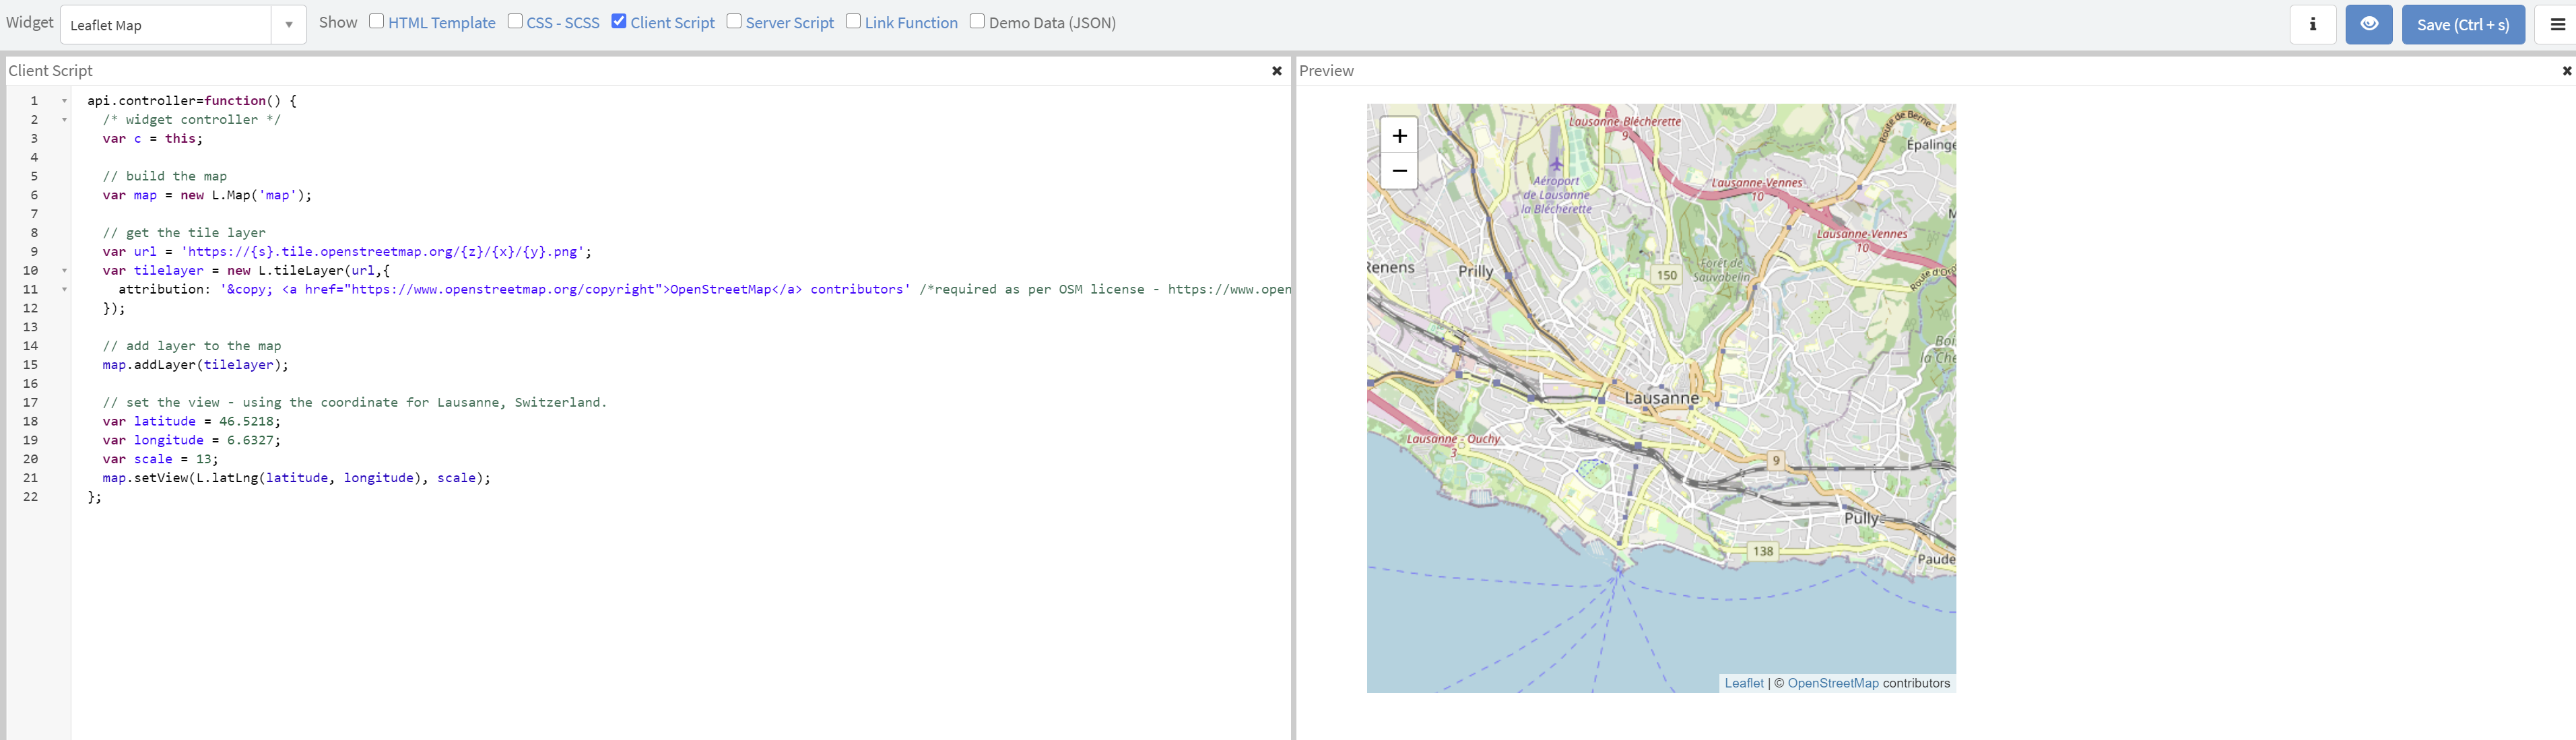
And finally the client script:
api.controller=function() {
/* widget controller */
var c = this;
// build the map
var map = new L.Map('map');
// get the tile layer
var url = 'https://{s}.tile.openstreetmap.org/{z}/{x}/{y}.png';
var tilelayer = new L.tileLayer(url,{
attribution: '© <a href="https://www.openstreetmap.org/copyright">OpenStreetMap</a> contributors' /*required as per OSM license - https://www.openstreetmap.org/copyright/en */
});
// add layer to the map
map.addLayer(tilelayer);
// set the view
var latitude = c.options.start_position_latitude;
var longitude = c.options.start_position_longitude;
var scale = c.options.start_scale;
map.setView(L.latLng(latitude, longitude), scale);
};
As a good practice, we should avoid to hardcode the values in the script and use options instead. So we still need to add this JSON in the Option schema of the widget. You can of course change the default value to suit your needs or change them later in the widget instances.
[
   {
      "name":"start_position_longitude",
      "section":"other",
      "default_value":"6.6327",
      "label":"Start position longitude",
      "type":"string"
   },
   {
      "hint":"",
      "name":"start_position_latitude",
      "section":"other",
      "default_value":"46.5218",
      "label":"Start position latitude",
      "type":"string"
   },
   {
      "name":"start_scale",
      "section":"other",
      "default_value":"13",
      "label":"Start scale",
      "type":"string"
   }
]
Make sure the widget option Has preview is checked and you can now vizualize the result with the Widget Editor:
Query the data from ServiceNow
Now that we have a map displayed, we need to add informations coming from the ServiceNow tables.
In this example we will show Users from the table sys_user. The position of each user will be determined by the location field.
Then we will use the longitute and latitude from the referenced Location (table cmn_location).
geoJSON format
To indicate Leaflet what to display and where, we need to provide the API with a geoJSON string 7 8.
Each “object” to put on the map is called a feature.
The GeoJSON standard specify various type of data that can be represented, but the one that suits our needs the best is the FeatureCollection, where multiple Features can be represented (but it work also if there is only one feature).
The format is as follow:
 {
	"type": "FeatureCollection",
	"features": [
		{
			"geometry": {
				"type": "Point",
				"coordinates": [
					x,
					y
				]
			},
			"type": "Feature",
			"properties": {
				"popupContent": "text",
				"iconText" : "iconText",
				"locationId" : "sys_id of location"
			}

		}
	]
}
The properties part is free, so we can set everything we need. For the example, there is
- popupContent, that contains the text to show on a pop-up when clikcing the location,
- iconText that is shown on the map (will be used for the count of record on each location,
- locationId that contains the sys_id of the location’s record.
Retrieving the data
To retreive the data, we will use a GlideAggregate on the table and group by the location. Note that the table, the name of the field that refernece the location table and the query on the table are coming from the Widget options:
	// get the options values
	var sourceTableName  = options.features_source_table;
	var locationFieldName = options.feature_location_field;
	var sourceTableQueryStr = options.feature_table_query;

	// get the data from the table to shown as features
	var featureGa = new GlideAggregate (sourceTableName);
	if (sourceTableQueryStr){
		featureGa.addEncodedQuery(sourceTableQueryStr);
	}
	featureGa.addNotNullQuery(locationFieldName);
	featureGa.addAggregate('COUNT');
	featureGa.groupBy(locationFieldName);
	featureGa.query();
Building the GeoJSON
To build the GeoJSON, we will use two functions: one to give the main GeoJSON object and another to build each Feature that will be added to the main GeoJSON object.
/**
	@name getGeoJSONFeaturesCollectionObject
	@description get the main GeoJSON Feature Collection Object
	@returns {object} GeoJSON Feature collection Object
**/
function getGeoJSONFeaturesCollectionObject () {
		return {
			"type": "FeatureCollection",
			"features": []
		};
	}


/**
	@name getFeatureObject
	@description Get the Feature part of the GeoJSON
	@param {GlideRecord} [loationGr] - GlideRecord from the Location table (cmn_location)
	@param {String} [popUpContent=] - Text for the feature's popup. If not provided, will default to the location's display value. Can contains "{0}", that will be replaced by the location's Display Value
	@param {String} [iconText=] - Text to show on the feature's icon. If not provided, will default to the location's display value.
	@returns {object} GeoJSON Feature collection Object
**/
function getFeatureObject (locationGr, popUpContent, iconText){
		popUpContent = popUpContent || locationGr.getDisplayValue();
		iconText = iconText || locationGr.getDisplayValue();

		return {
			"geometry": {
				"type": "Point",
				"coordinates": [
					parseFloat(locationGr.longitude),
					parseFloat(locationGr.latitude)
				]
			},
			"type": "Feature",
			"properties": {
				"popupContent": gs.getMessage(popupContent, [locationGr.getDisplayValue()]),
				"iconText" : iconText,
				"locationId" : locationGr.getUniqueValue()
			}

		};
	}
Then we use those functions when looping on the featureGa records to generate the GeoJSON:
	// get the GeoJSON object
	var geoJSONobj = getGeoJSONFeaturesCollectionObject();

	// for each feature
	while (featureGa.next()){
			// set the popup content from the options, ot use the displayValue if not set
			var popupContent = options.feature_popup_content || featureGa.getDisplayValue();

			// get the feature object
			var featureObj = getFeatureObject(
				featureGa[locationFieldName].getRefRecord(), /*get the referenced location record*/
				popupContent,
				featureGa.getAggregate('COUNT') /*use the count as the iconText*/
			);

			// add in the GeoJSON features
			geoJSONobj.features.push(featureObj);
		}
	// set the geoJSON in the data, so it can be used on the client script
	data.geoJSONobj= geoJSONobj;
Don’t forget to add the options…
As you may have notice, we use the widet’s options to set the table, the fields, and so in the server script. You need to add the following options in the Option Schema of the widget:
   {
      "hint":"Name of the table to show as features on the map",
      "name":"features_source_table",
      "section":"other",
      "default_value":"sys_user",
      "label":"Features Source Table",
      "type":"string"
   },
   {
      "hint":"Name of the field that reference the location on the table shown as features on the map",
      "name":"feature_location_field",
      "section":"other",
      "default_value":"location",
      "label":"Feature location field",
      "type":"string"
   },
   {
      "hint":"Query string to apply on the table shown as features on the map",
      "name":"feature_table_query",
      "section":"other",
      "default_value":"location.nameSTARTSWITHLausanne",
      "label":"Feature table query",
      "type":"string"
   },
      {
      "hint":"Supports {0}, that will be replaced by the location display value. Supports HTML.",
      "name":"feature_popup_content",
      "section":"other",
      "default_value":"This is the feature '{0}'",
      "label":"Feature popup content",
      "type":"string"
   }
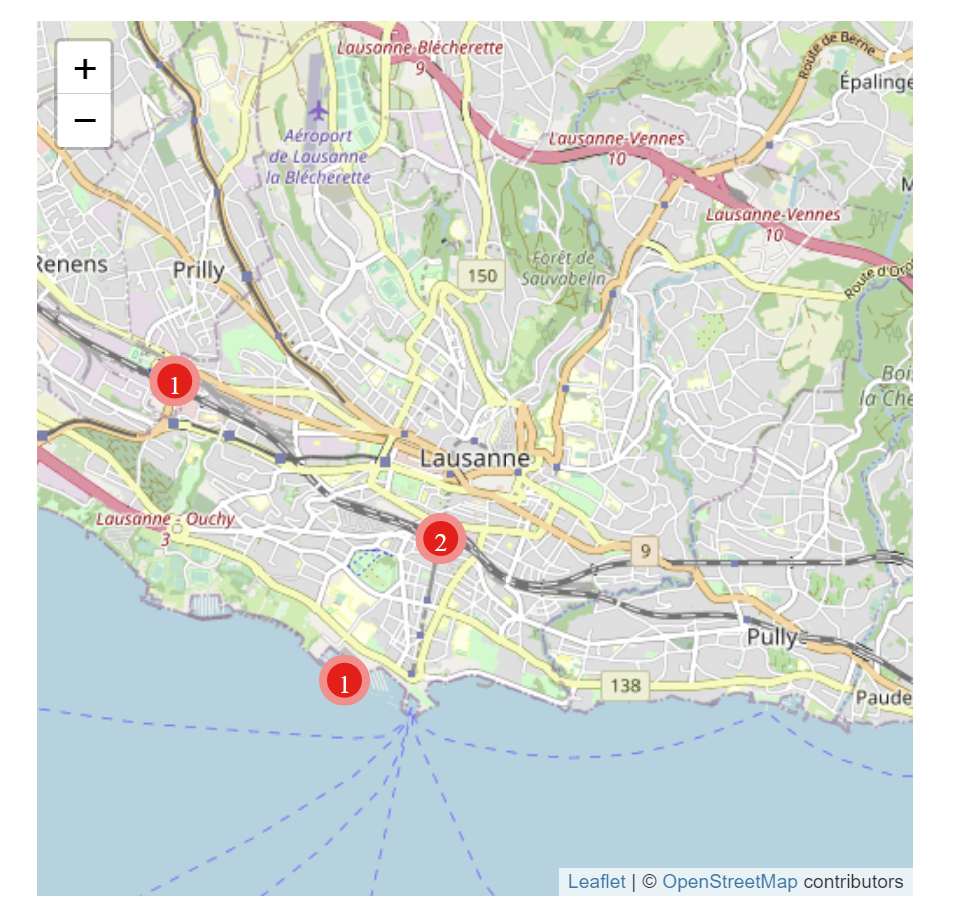
Display the features on the map
Now that we have a geoJSON availlable, we need to handle it in the client script. For this we will use the API geoJSON function and we will define onEachFeaturefunction that will set up the popup content and trigger the function clickActionwhen the feature is clicked. We will also define pointToLayer to draw an icon and display the iconText on the map.
	var geoJSONobj = c.data.geoJSONobj;
	L.geoJSON([geoJSONobj], {

		onEachFeature: function(feature, layer) {
			// prepare the popup content with the feature's properties
			var popupContent = "";
			if (feature.properties && feature.properties.popupContent) {
				popupContent += feature.properties.popupContent;
			}
			// set the popup content and call clickAction on click
			layer.bindPopup(popupContent).on('click', clickAction);
		},

		pointToLayer: function (feature, latlng) {
			// prepare the icon text
			var iconText = "";
			if (feature.properties && feature.properties.iconText) {
				iconText = feature.properties.iconText;
			}

			// create a DIV icon.
			var myIcon = L.divIcon({
				className: 'map-label-content', /*important to style it with CSS*/
				iconSize: [29,29],
				html:iconText /*this is the text shown on the map*/
			});

			// return a marker with the icon
			return L.marker(latlng, {icon: myIcon});
		}
	})
		.addTo(map);

	function clickAction(e) {
		// center on the clicked feature
		map.setView(e.target.getLatLng(),map.getZoom());
	}
Then (and this is important, otherwise it doesn’t work), we need to define the CSS code for our icon (the one with the class name map-label-content). You can drop this code in the CSS section of the Widget:
.map-label-content {
  background:red;
   border:5px solid rgba(255,255,255,0.5);
  text-align: center;
  position: absolute;
  overflow: hidden;
  background-repeat: no-repeat;
  background-position: center;
  color: #fff;                    // icon color
  width: 29px;
  height: 29px;
  border-radius: 50%;             // make a circle
 /* line-height: 22pt;*/
  font-size: 15px;
  font-family: 'FontAwesome';     // anything goes
  filter: drop-shadow(2px 2px 2px rgba(0,0,0,0.5));
}
The CSS is probably not perfect, but it does the job. If there is any CSS freaky around that have hints for improvements, please feel free to contact me 🙂.
A simpler alternative….
If you want something simpler, without displaying the number of records on each location, you can replace the content of the function pointToLayer with this code:
pointToLayer: function (feature, latlng) {
	/* The simpler alternative*/
	return L.circleMarker(latlng, {
		radius: 8,
		fillColor: "#ff7800",
		color: "#000",
		weight: 1,
		opacity: 1,
		fillOpacity: 0.8
	});
}
You can then also drop the CSS part for map-label-content

Enable interaction with the ServiceNow Portal
Trigger an event from the map, when cliking a feature
The last addition to our map widget is to broadcast an event when a feature is clicked.
To do so, you can simply add this line of code in the clickAction function in the client script of the widget:
	// trigger event
	$rootScope.$broadcast('mapFeatureClick', e.target.feature.properties.locationId);
This will send an event mapFeatureClick with the sys_id of the location.
Now the map widget is ready, it is time to start preparing the widget responsible for the list and then put them together on a page
A quick and dirty list widget
For our list widget, we will clone the existing widget “Simple List” (widget-simple-list).
⚠ To avoid the handling the script parts that are using ServiceNow functions that are not availlable in scoped application, I strongly suggest to set your scope to global. Otherwise prepare yourself to adapt the Simple List widget clone to make it work in a scoped application…
So, make sure to be in the global scope and clone the “Simple List” widget to “List linked to map”.
Then add a listener in the client script of you new widget, to react when mapFeatureClick is broadcasted:
	$rootScope.$on('mapFeatureClick', function(event,data) {
		c.data.locationFilter =  data;
		c.server.update();
	});
This will set a new variable locationFilter in data.
Then we need to modify the server script to use this locationFilter to filter the records that are shown on the list:
/* to insert just after line 30:
...
if (input && input.filterText)
	gr.addEncodedQuery(options.display_field + "LIKE" + input.filterText)
*/
if (input && input.locationFilter)
		gr.addQuery('location', input.locationFilter);

/*
options.title = options.title || gr.getPlural();
...
*/
You can then save the widget.
Creating the portal page and test it
The last step is now to create a simple portal page and add the two widgets to it.
Set the list widget options to query the user table (sys_user) and select the primary and secondary fields.
Then make you have users in the correct location and test you page. The list will be filtered according the location you select on the map.
Conclusion
In this article we created a basic map widget, that can be used to interact with the service portal. There is plenty of room for improvements and for adding extra features, but I believe it is a good starting point.
I enjoyed digging in the geo data and map rendering world and I will probably follow up this article with other implementations, like positionning the map when a record is selected in a list, or displaying a custom floor plan and so on. So stay tuned 😉
Please leave you comments or questions below.
ℹ All the code for the map widget is availlable in GitLab.
⚠ IMPORTANT Remarks about OpenStreetMap server usage
As you probaly noticed, we are using the OpenStreetMap server to get the Tiles for our map. This is perfectly fine for some tests and for playing around, but there are some points that need to be considered if this is going to be used “in real life”.
The OSM foundation policy 9 states:
We are in principle happy for our map tiles to be used by external users for creative and unexpected uses – in contrast to most web mapping providers, which insist that you use only their supplied API.
However, OpenStreetMap’s own servers are run entirely on donated resources. They have strictly limited capacity. Heavy use of OSM tiles adversely affects people’s ability to edit the map, and is an abuse of the individual donations and sponsorship which provide hardware and bandwidth. As a result, we require that users of the tiles abide by this tile usage policy.
Therefore I would recommand to use a commercial Tile server or even to setup your own Tile server for your maps. You can find a list of Tile servers here 10 and some information about setting up a Tile server here 11.
References
-
OpenStreetMap wiki - accessed 2020 12 12 ↩︎
-
Leaflet web site, Leafletjs.com - accessed 2020 12 12 ↩︎
-
OpenLayers web site, OpenLayers.org - accessed 2020 12 12 ↩︎
-
Leaflet’s Quick Start Guide, Quick Start Guide - accessed 2020 12 12 ↩︎
-
Leaflet’s download page, [Leafletjs.com - version 1.7.1 ↩︎
-
GeoJSON web site, geojson.org - accessed 2020 12 12 ↩︎
-
OSM foundation, Tile Usage Policy - accessed 2020 12 12 ↩︎
-
OpenStreetMap wiki, Tile servers - accessed 2020 12 12 ↩︎
-
OpenMapTiles - accessed 2020 12 12 ↩︎


Comments powered by Talkyard.